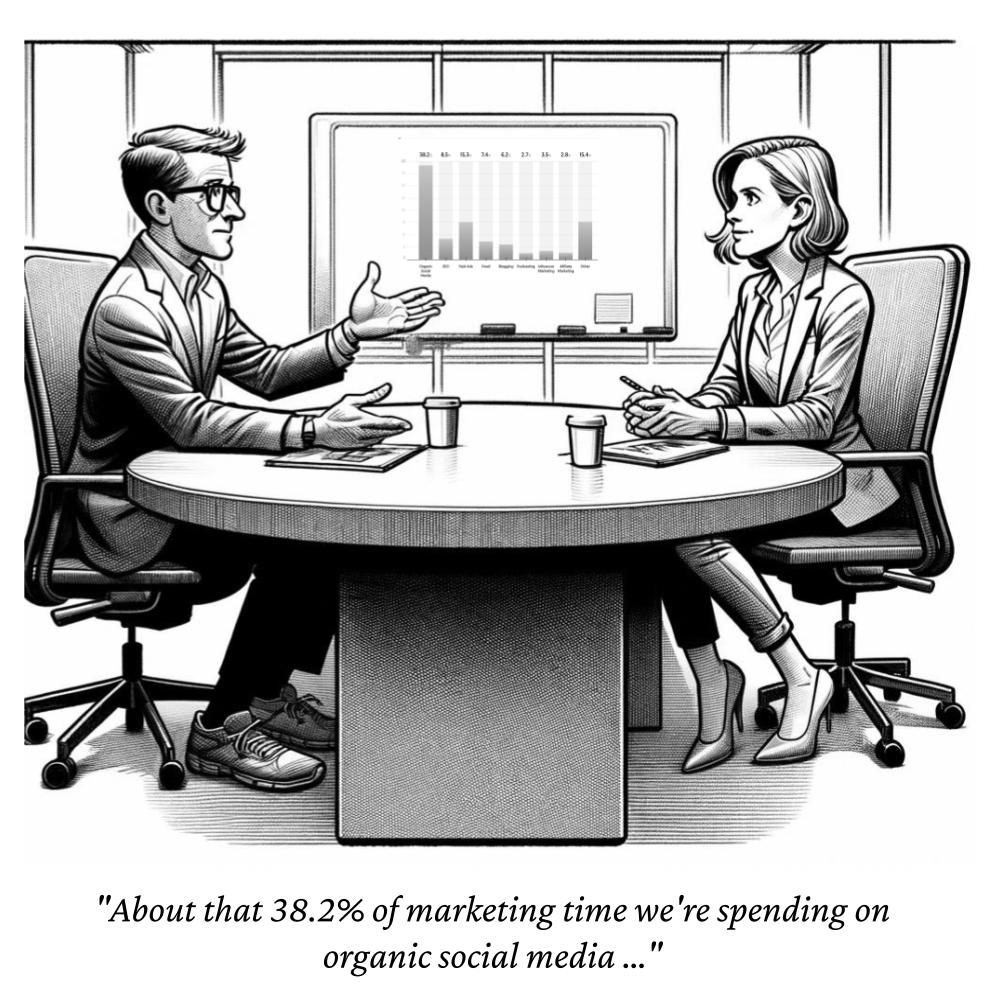
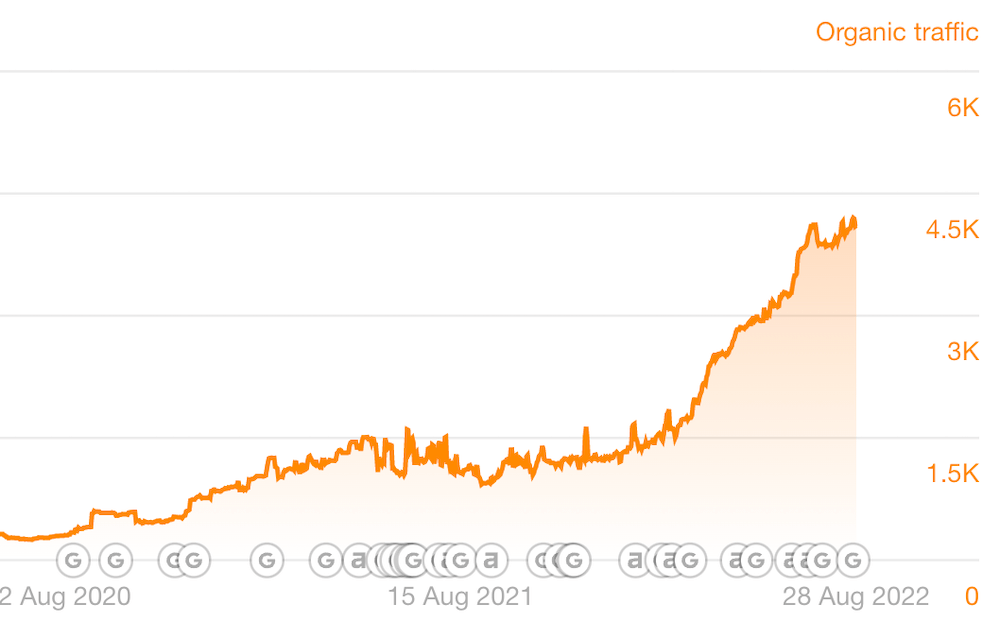
Where a company’s staff spends its time on B2B marketing varies by industry and other factors.
NP Digital surveyed 118 companies in different verticals, generating at least $100 million in annual revenue.
Presumably, based on NP Digital’s customer base, the surveyed companies were both B2B and B2C.
The two questions that were asked were:
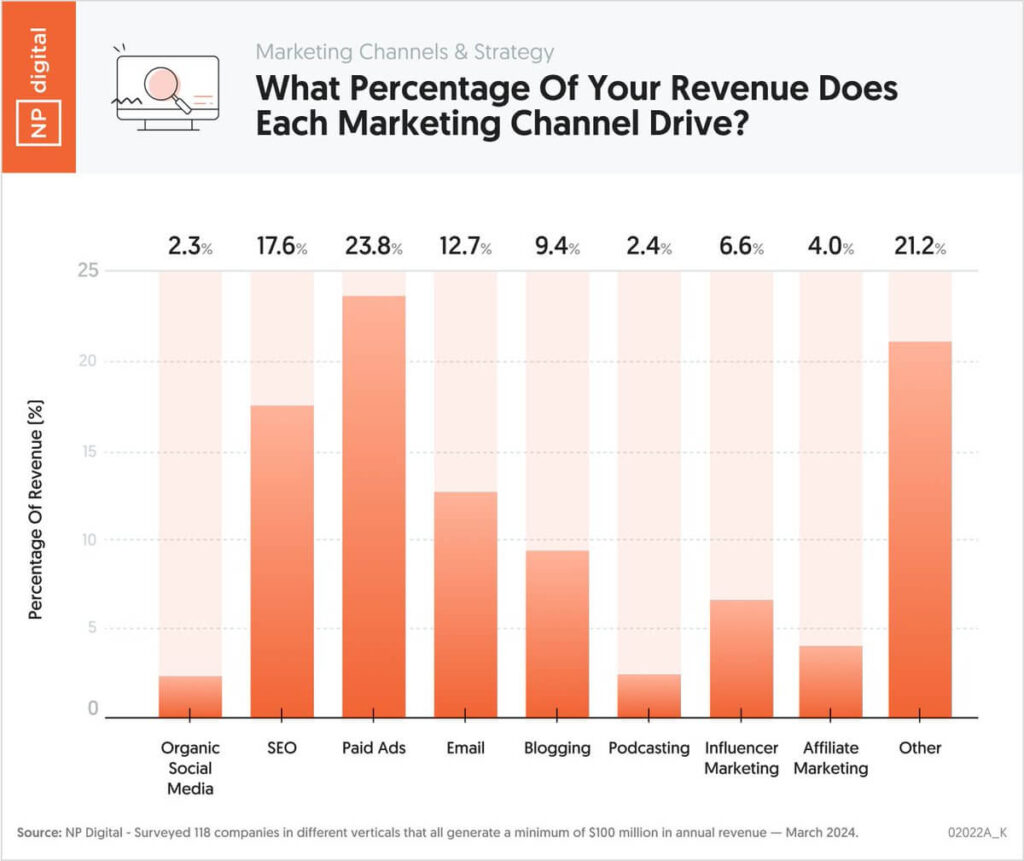
- What Percentage Of Your Revenue Does Each Marketing Channel Drive?
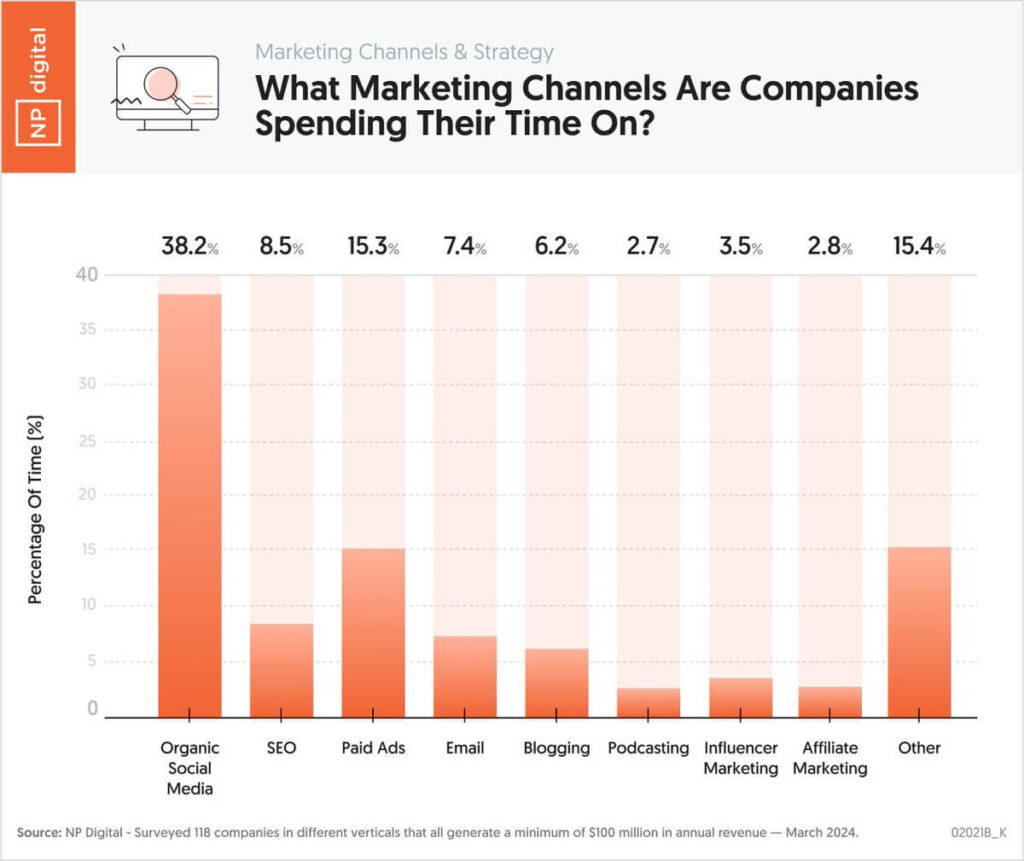
- What Marketing Channels Are Companies Spending Their Time On?
The Survey Results
CEO Neil Patel posted the survey results on X.
The post resulted in many replies, including ones that questioned:
- Channel attribution (first, last, multi)
- What’s in the ‘Other’ category
- Whether ‘Other’ is too large a category
- Where YouTube videos fit in
Neil explained the large ‘Other’ category as “in-person events, speaking at events, conference booths, PR, radio, handwritten notes, etc…”
I questioned why SEO and blogging were separated. Neil’s answer was,
“For the study we separated out blog traffic… yes a blog gets traffic from seo, social, etc… but felt it should be split out as in most large companies the blogging has its own team and resources.”
Despite the survey’s imperfections, the results are worth paying attention to. Among respondents:
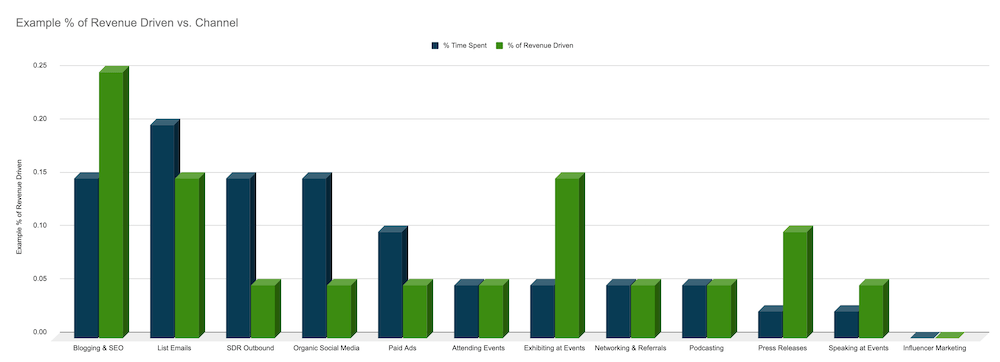
- An excessive amount of time is spent on organic social media relative to its revenue influence
- SEO and blogging combined drive over a quarter of revenue
- SEO is the most efficient marketing channel in terms of revenue vs. time spent
- Companies spend comparatively little time on podcasting, and the results reflect this
Your B2B Marketing Mix
The mix of your B2B marketing channels time spent and revenue may look very different from the charts above.
One reply to the X post was from a marketing agency CEO who said, “We get 90% of our business from organic social.”
Over the years, our CRM consulting group has acquired almost all its new customers from organic search, which has been the main channel for our audience to date.
Based on the survey results, are there any marketing time allocations you may change?
As an exercise, you could enumerate your marketing channels in a spreadsheet and assign the percentage of time spent across all team members.
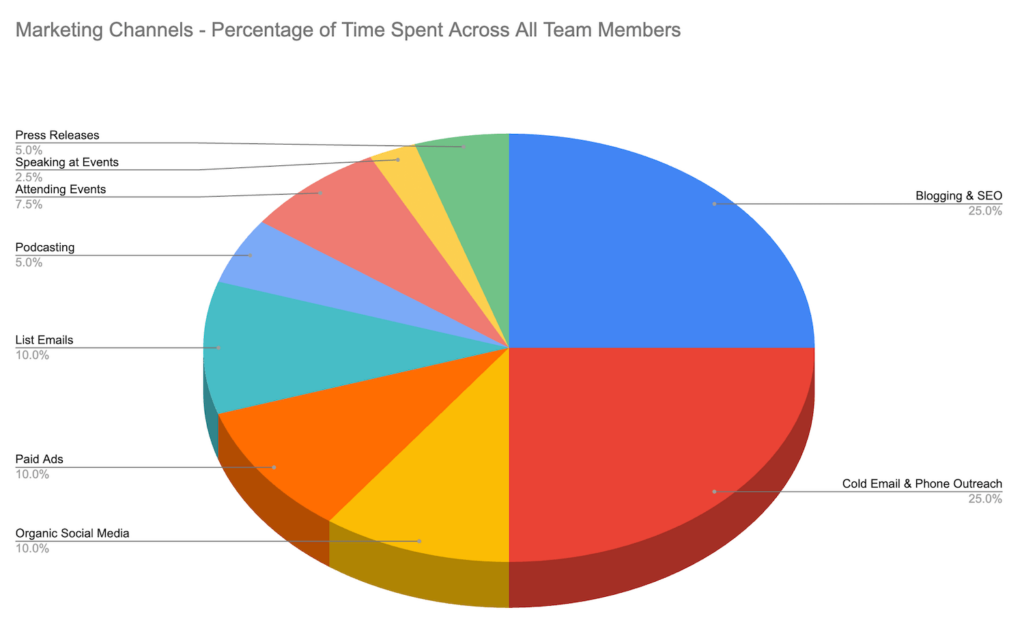
Here’s a fictional table and associated pie chart.
| Channel | Percentage of Time Spent |
|---|---|
| Blogging & SEO | 25.0% |
| Cold Email & Phone Outreach | 25.0% |
| Organic Social Media | 10.0% |
| Networking & Referrals | 0.0% |
| Paid Ads | 10.0% |
| List Emails | 10.0% |
| Podcasting | 5.0% |
| Attending Events | 7.5% |
| Speaking at Events | 2.5% |
| Press Releases | 5.0% |
| Influencer Marketing | 0.0% |
| Total | 100.0% |
From there, you can approximate the allocation of revenue to each channel.
If you change your channel time allocation, you can redistribute existing content on some channels to others.

